
Posted: March 12, 2022
The Graphic Equalizer: why it exists and how it is used.
The human hearing has a range between 20Hz and 20,000Hz. That range is divided into 10 octaves or bands.
In the 10-band graphic equalizer below, each one of the sliders represents the center frequency of its corresponding band. Each center frequency on the equalizer is a doubling of the previous center frequency.
And so you have the following center frequencies: 32Hz, 64Hz, 128Hz, 256Hz, 512Hz, 1000Hz (1KHz), 2000Hz (2KHz), 4000Hz (4KHz), 8000Hz (8KHz), 16,000Hz (16KHz). Each of these center frequencies is a doubling of the previous one.

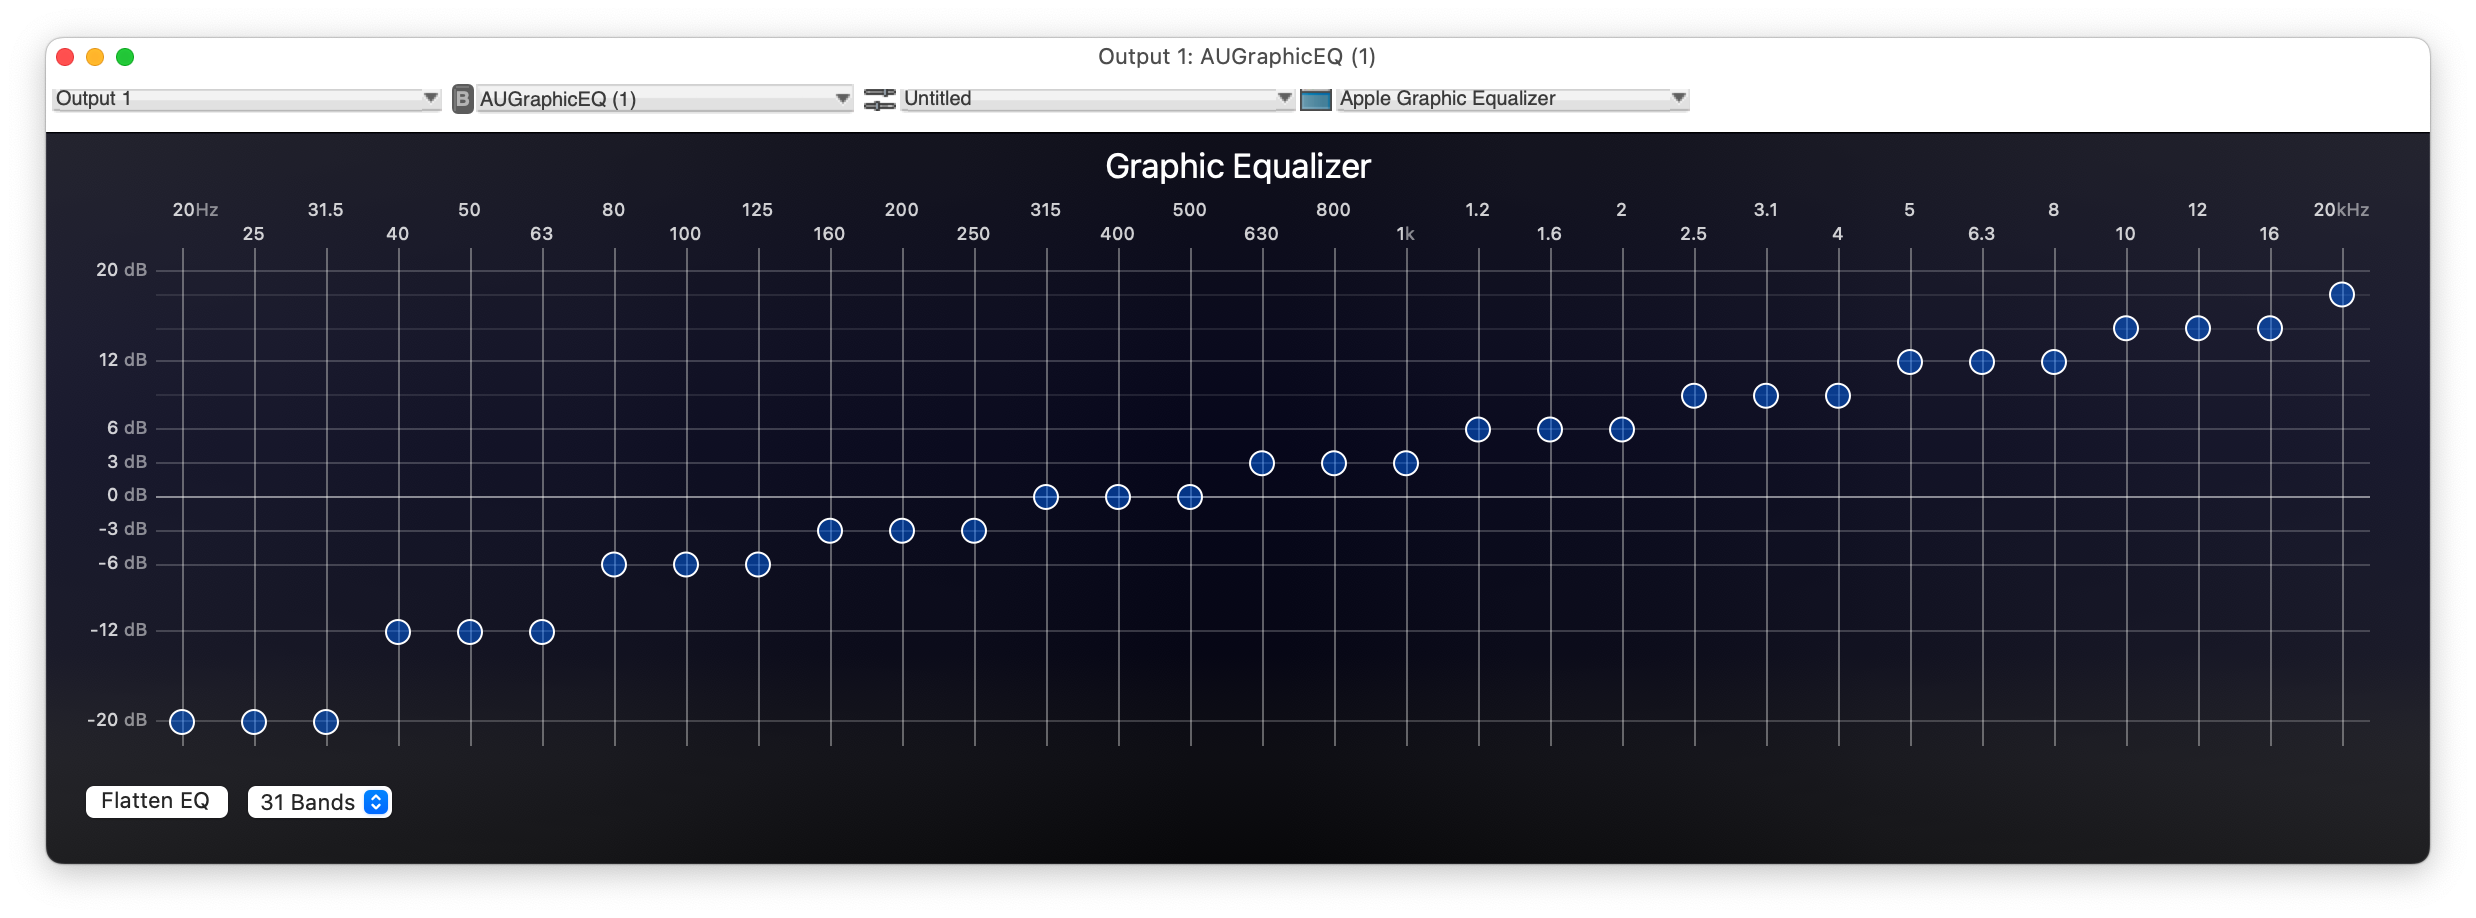
Let us now look at the 31-band equalizer:
In this case each of the 10 octaves of human hearing has been divided into thirds; hence the name 1/3 EQ or 31-band EQ. Doing this provides greater resolution and a more granular level of control since you now have 3 sliders per octave instead of just the one slider.
OK. Why so many sliders?
Graphic EQ is primarily used in three ways:
To correct the frequency response of a speaker
To correct the frequency response of the room that speaker will be playing in
To adjust the tonality of the overall sound as needed.
There are other uses, as well, such as tuning out troublesome frequencies that loopback into open mics causing that detestable screeching sound we call feedback. Digital equipment now exists that can do this instantly with minimal user interaction, so using a 31-band graphic EQ for this purpose might be regarded by some as rudimentary, but I digress…
So, again, why so many sliders?
Because each slider is an individual volume control that either increases or decreases the volume level for each specific center frequency.
Look at this graph:

The on axis frequency response curve is pretty flat. Clearly, this studio monitor does not need any eq correction.
Lets now look at this other graph:

OK. So this is pretty bad for any speaker. In fact, I do not think this is a frequency response curve for any speaker at all, but let us use it nonetheless, just to illustrate the point. So how would you correct this speaker using eq?

Voilà! You get the point. I’m not trying to be precise here.
The actual process of correcting a speaker’s frequency response curve is much more involved:
You would first have to plot your speaker’s actual response curve by passing test tones through your speaker at the exact center frequencies of your eq and noting down the SPL reading (in decibels) shown on the screen of your SPL meter (positioned one meter away from your speaker), in order to then increase or decrease the volume of each center frequency until they are all more or less consistent blah, blah, blah… there are tons of websites that explain the process, I will not do that here… Are you still there?
So once you have corrected the individual frequency response of each one of your speakers, comes time to fix the frequency response of the listening room. Now, I would not even attempt to do that without first treating the surfaces of the room, it would be a nightmare otherwise. This is why it pays to do your homework and to buy a speaker that is as flat as possible. It saves you lots of work. And this is also why I prefer flat studio monitors—dealing with room acoustics is bad enough.
I apologize for that rant, but I am not changing any of it. I believe it serves a purpose.
Anyway. I think we are done here. I think I have explained why the Graphic Equalizer exists and how it is used. Let me know what you think in the comments section below… Oh! There is no comment section. E-mail me then!